
The Landings, South Harbor, Modena, Grand Harbor & Private Estates
By Cristina Callegari, REALTOR® | Luxury Collection Specialist
Course & Coast | Berkshire Hathaway HomeServices Bay Street Realty Group
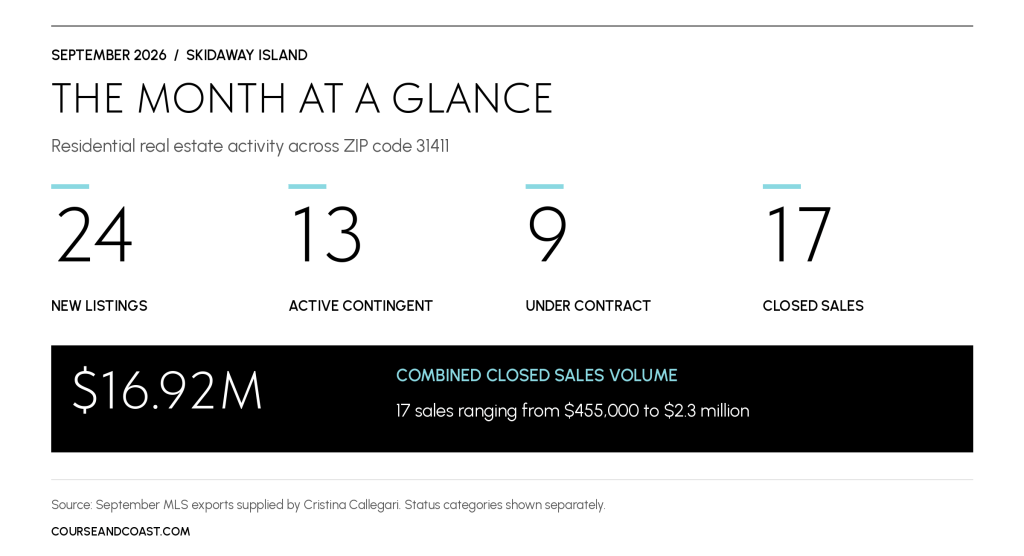
September brought 17 residential closings on Skidaway Island, with individual sale prices ranging from $455,000 to $2.3 million. Together, those transactions generated $16.92 million in total sales volume. Six homes sold above $1 million, demonstrating continued activity at the upper end of the market, while the wide variation in market times revealed a more uneven picture: some properties moved within days, while others required months to find a buyer.
The island ended September with 70 homes actively available for purchase, excluding properties already Active Contingent or Under Contract. Buyers have alternatives, but those choices are not evenly distributed across communities or price points. For sellers, the important question is not simply how many homes are available—it is how convincingly their property competes with the homes a buyer would actually consider alongside it.
New Listings
September brought 24 new residential listings to market:
- 20 in The Landings
- 3 in Grand Harbor
- 1 in South Harbor
- 0 in Modena
The average asking price was $937,354, with an average of approximately $307 per square foot. Prices ranged from $489,000 to $1.85 million, and the median asking price was $849,000.
For perspective, June also brought 24 new listings, with an average asking price of $944,683. September’s incoming inventory was therefore similar in both count and average price, although the individual properties differed. This comparison describes sellers’ asking expectations, not a change in underlying property values.
Grand Harbor’s three new listings were priced from $849,000 to $999,000, while South Harbor’s addition was offered at $1.05 million. Those properties broaden the choices available beyond The Landings without making the communities interchangeable. Buyers still need to weigh the specific home, setting and ownership experience against the alternatives.
What matters next is how buyers respond to September’s new selection. Watching which properties secure contracts—and which require adjustments—will tell us more about pricing strength than their initial appearance on the market.
Active Inventory
As of September 30, Skidaway Island had 70 active residential listings:
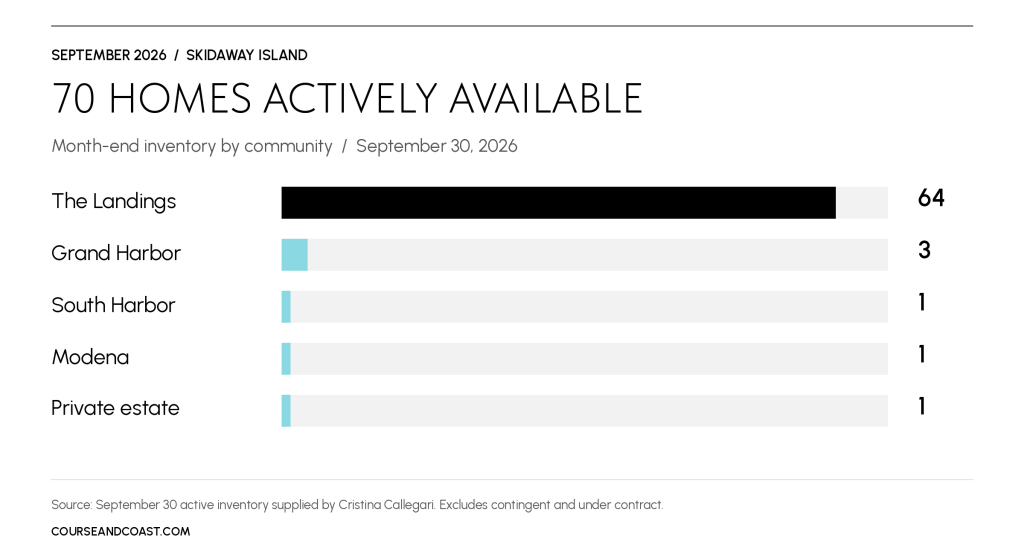
These figures exclude Active Contingent and Under Contract listings.
Measured against September’s 17 closings, that represents approximately 4.1 months of inventory at the month’s sales pace. This is a snapshot based on one month, rather than a seasonally adjusted or longer-term absorption rate, but it provides useful context for the choices buyers have heading into October.
More than 90% of the available homes were in The Landings. Islandwide inventory therefore tells us much more about competition within The Landings than it does about availability in South Harbor or Modena, where buyers had only one active listing in each community.
The same distinction applies within The Landings itself. Seventy available homes across the island do not mean 70 suitable alternatives for an individual buyer. Budget, setting, size and condition narrow the field considerably.
Active Contingent
Thirteen homes moved to Active Contingent during September:
- 12 in The Landings
- 1 in Grand Harbor
- 0 in South Harbor
- 0 in Modena
These homes averaged $853,369 in asking price, or approximately $291 per square foot. Asking prices ranged from $465,000 to $1.365 million.
Median market time was 54 days, but that figure encompasses very different experiences. Four properties secured contingent contracts within 30 days, while four had accumulated more than 100 days on market. Two had been listed for 243 and 362 days, respectively.
September’s buyers were therefore considering more than the newest listings. Properties with lengthy exposure were still finding buyers, even as other homes attracted commitments relatively quickly.
Extended market time should prompt a closer examination of pricing history, condition and competing properties rather than an automatic dismissal. The activity confirms that older inventory was moving, although the figures alone do not establish which negotiations or property attributes ultimately brought the parties together
Under Contract
Nine homes were reported in the separate Under Contract category:
- 8 in The Landings
- 1 in Grand Harbor
- 0 in South Harbor
- 0 in Modena
Their average asking price was $871,778, or approximately $282 per square foot, with prices ranging from $649,000 to $1.199 million.
Median recorded market time was 12 days, and six of the nine properties showed 15 days or fewer. This is an important counterpoint to the longer exposure seen among some contingent properties: buyers were also committing to homes early in their listing periods.
Active Contingent and Under Contract represent different stages of the transaction process and are reported separately. The prices in both categories are asking prices, not disclosed final purchase prices.
Closed Sales
September concluded with 17 residential closings:
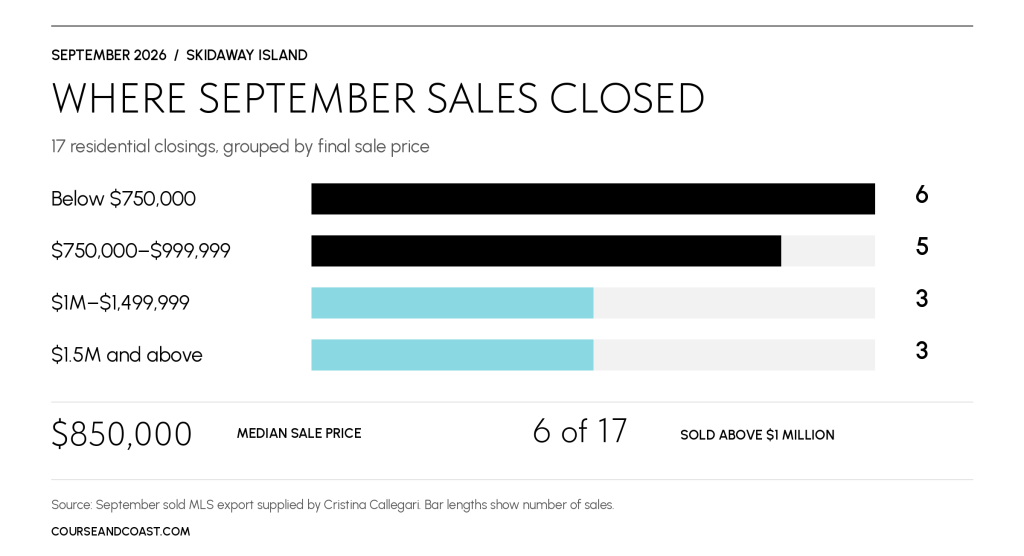
- 17 in The Landings
- 0 in Grand Harbor
- 0 in South Harbor
- 0 in Modena
Total sales volume reached $16,921,725. The average closing price was $995,396, or approximately $309 per square foot, with sales ranging from $455,000 to $2.3 million. The median sale price was $850,000.
Six transactions exceeded $1 million and accounted for approximately 56% of the month’s dollar volume. The highest was 2 Marsh Bridge Lane at $2.3 million, followed by 127 Waterway Drive at $1,837,725 and 6 Huntingwood Retreat at $1.6 million.
Those upper-end transactions materially influenced the average. September’s average sale price approached $1 million, while the middle transaction in the 17-sale group closed at $850,000. Both figures are useful, but they describe different aspects of the market.
One of September’s more revealing results was the difference in market time by price segment. The six million-dollar-plus closings recorded a median of 10.5 days, compared with 51 days for sales below $1 million. Higher prices did not necessarily mean longer waits. Two of those upper-end transactions recorded zero days on market, so the comparison should not be treated as a prediction for every luxury listing.
Across all closings, average market time was 77 days, while the median was 37 days. Several long-market properties pulled the average upward, illustrating how a handful of transactions can shape the monthly headline.
June recorded 28 closings at an average of approximately $1.24 million. September’s lower count and average are worth noting, but they do not establish that individual property values declined by a corresponding amount. Monthly averages change with the mix of homes sold. A reliable pricing trend requires comparable properties and a longer sequence of results.
Looking Ahead
With 70 homes available heading into October, buyers have room to compare, and sellers have a clear reason to examine their competition carefully. At September’s closing pace, that inventory represents approximately four months of sales. The practical message is that buyers have choices, but September’s quick-moving transactions show that desirable alternatives will not necessarily remain available for long.
For sellers, the key is understanding where a property stands within its actual competitive set. Some million-dollar homes moved quickly, while some less expensive properties required months. A higher-priced sale nearby is relevant only when the differences in setting, condition, layout and improvements support the comparison. Selecting the strongest sale and ignoring those differences can create an asking price that buyers will not validate.
For buyers, the opportunity lies in distinguishing a genuinely competitive property from one that simply carries an ambitious price. Longer exposure deserves investigation, not automatic dismissal. Conversely, the presence of slower-moving inventory does not mean every home will remain available while a buyer waits.
The range in closed prices per square foot reinforces that point. September’s sales ranged from approximately $157 to $518 per square foot. Applying the islandwide average to a specific home without examining the underlying differences can produce a misleading valuation in either direction.
I’ll be watching how many of September’s new listings secure contracts in October, whether longer-market properties continue to find buyers, and how the active inventory changes as those transactions progress. Those measures will help distinguish a temporary shift in the mix of homes sold from a more meaningful change in market conditions.
My reading of September is that Skidaway continues to support meaningful transactions across a broad price range, including substantial purchases at the luxury end. Buyers have options, sellers face real competition, and individual outcomes vary considerably. Understanding those differences is far more useful than declaring the entire island either strong or soft.
The market tells a story—but the averages rarely tell the whole story. The most useful analysis connects the islandwide numbers to the particular property, its competition and the decisions facing its buyer or seller.
If you’re considering buying or selling on Skidaway Island, let’s talk about what these numbers mean for you. I’ll help you evaluate the relevant sales, understand your competition and develop a strategy grounded in your goals and today’s market. Contact me for a personal conversation about your next move—whether it’s approaching soon or still taking shape.
